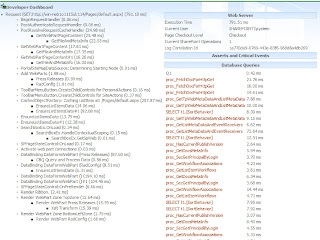
In this kind of scinarios we need to figure out on which web part where it is taking long time to get the data to fix the performance issues.
Here sharepoipnt provided a good feature to calculate this kind of information called Developer dashboard.
steps to do this :
1. Enable developer dashboard through powershell
2. select developer dashboard and analyze your page health report.
Here is the Powershell script :
Dashboard : On
$service = [Microsoft.SharePoint.Administration.SPWebService]::ContentService
$addsetting =$service.DeveloperDashboardSettings
$addsetting.DisplayLevel = [Microsoft.SharePoint.Administration.SPDeveloperDashboardLevel]::On
$addsetting.Update()
Dashboard : Off
$service = [Microsoft.SharePoint.Administration.SPWebService]::ContentService
$addsetting =$service.DeveloperDashboardSettings
$addsetting.DisplayLevel = [Microsoft.SharePoint.Administration.SPDeveloperDashboardLevel]::Off
$addsetting.Update()
After this you can just go to your site home page or any other site pages. Here you will find a new image icon just beside the login account name control like

Click on that then you will get the complete report of the page like
1. how much time it is taking for each web part.
2. Stored procedures executing time.
3. Events load time etc..

Thank you !!
No comments:
Post a Comment